USD/JPY Forecast 2026: Yen Strength Faces Carry Trade Risks
The USD/JPY pair is trading around 152.70 as of mid-February 2026, down notably from highs above 156 seen late last year. This yen appreciation reflects shifting central bank expectations and lingering concerns over carry trade positioning.
Current Market Dynamics
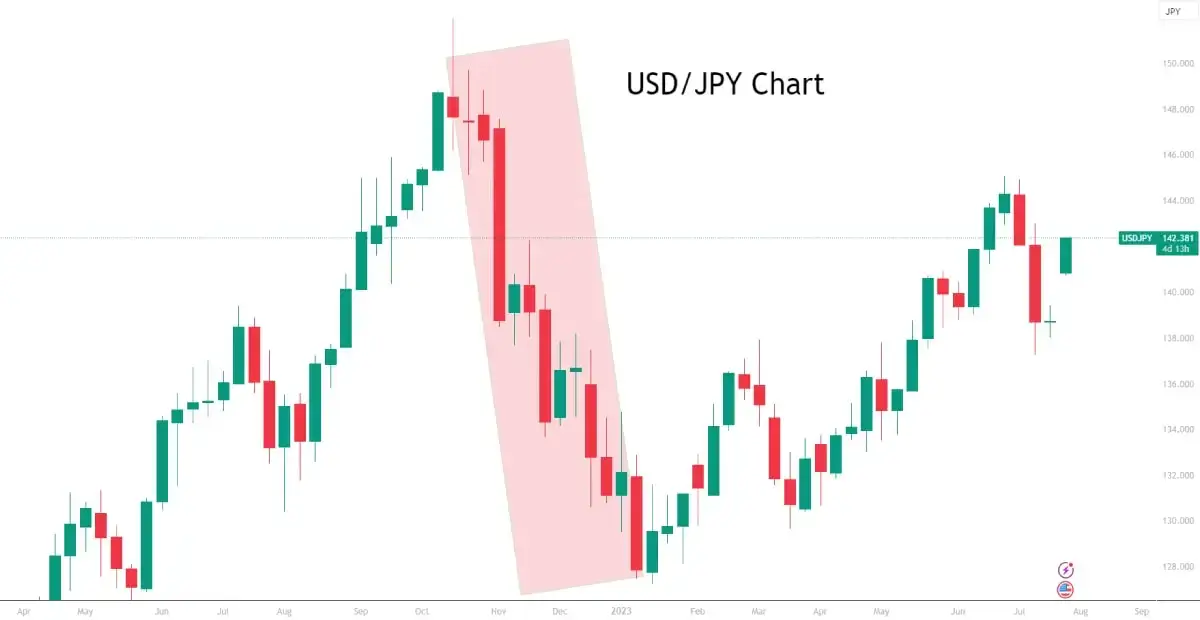
Early 2026 has seen renewed downward pressure on USD/JPY, with the pair declining over 2% since January amid policy signals from Tokyo and a more cautious Federal Reserve stance.
| Date | Closing Level | Daily Change (%) |
|---|---|---|
| Feb 13 | 152.76 | -0.03 |
| Feb 12 | 152.73 | -0.32 |
| Feb 11 | 153.26 | -1.10 |
| Feb 10 | 154.38 | -1.20 |
Key Drivers Behind Yen Appreciation
Bank of Japan Signals Further Normalization
The BOJ has maintained a hawkish tone, holding rates but indicating potential adjustments if wage growth and inflation remain supportive. Fiscal restraint post-election has also aided yen sentiment.

Fed Pause Reduces Rate Differential Appeal
With US growth resilient, the Federal Reserve has limited further easing, narrowing but not eliminating the yield gap favoring USD.
| Central Bank | Current Rate | Expected 2026 Trajectory |
|---|---|---|
| Federal Reserve | 3.50–3.75% | Few or no cuts |
| Bank of Japan | 0.75% | Possible gradual hikes |
Carry Trade Unwind Risks Remain Elevated
Rising Japanese rates and episodic risk-off flows continue to pressure yen-funded carry trades. A decisive break below 152 could accelerate unwinding.

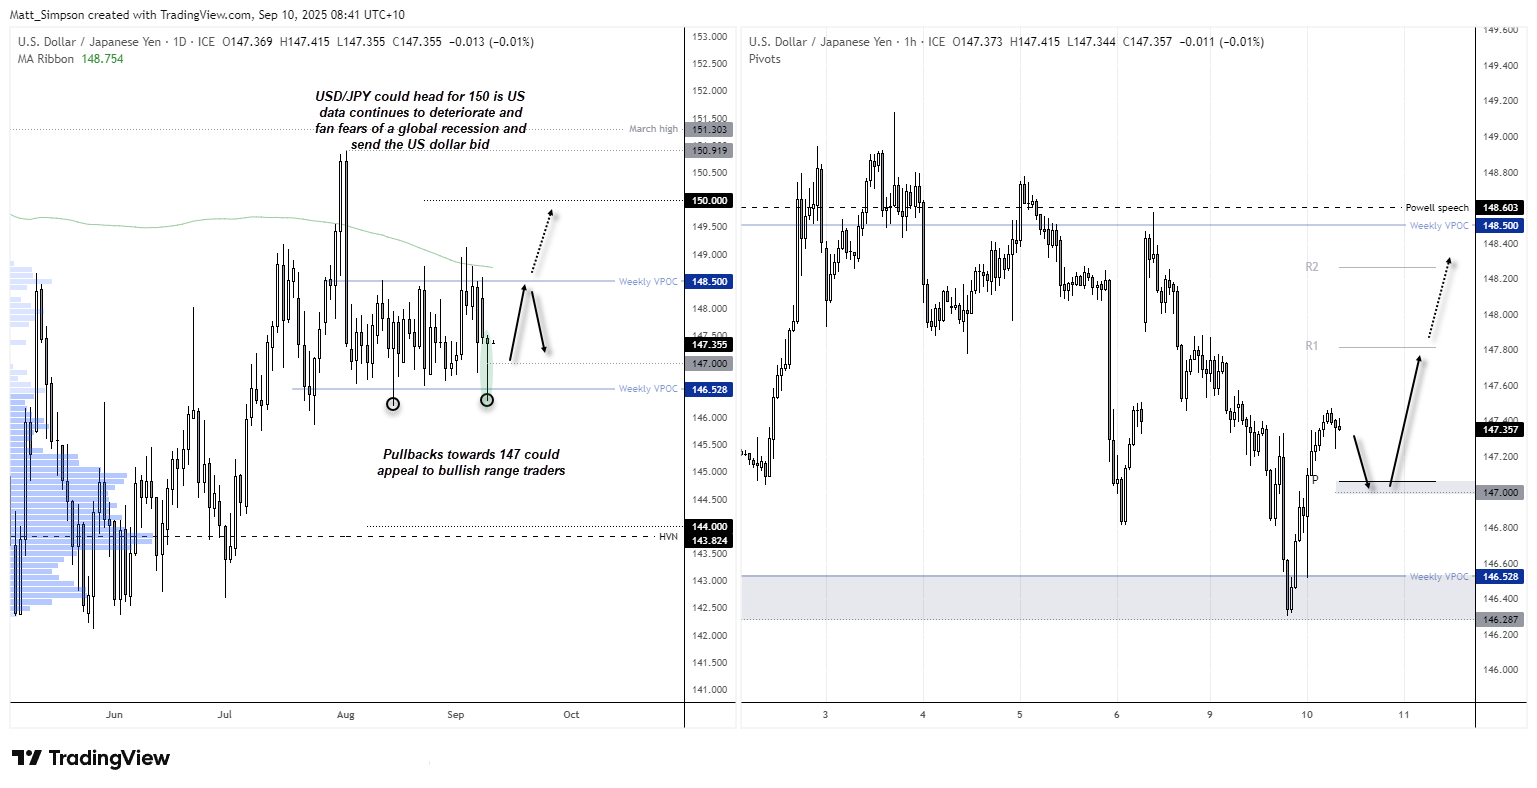
Technical Outlook and Key Levels
Support cluster near 152 aligns with moving averages; resistance above 154–156. Sustained weakness could target 150 psychological zone.
Counterarguments: Potential USD Rebound Triggers
Stronger-than-expected US data or delayed BOJ tightening could revive USD/JPY upside toward prior highs.

Retail and community sentiment shows mixed views. Recent discussions highlight hedge funds turning yen-bullish despite resilient US indicators:
Reddit r/investing thread: Hedge funds turning bullish on yen despite strong US data
Conclusion and Practical Advice
While policy divergence supports yen strength in the near term, carry trade dynamics introduce volatility risks. Monitor central bank communications and key technical levels closely.
Diversify currency exposure, use stop-losses in forex positions, and consult professional advisors. Stay updated with Flux Market for ongoing currency analysis.
References
- FOREX.com – USD/JPY Weekly Forecast: Link (Accessed Feb 15, 2026)
- FX Empire – Japanese Yen Weekly Forecast: Link (Accessed Feb 15, 2026)
- City Index – USD/JPY Forecast: Link (Accessed Feb 15, 2026)
- Trading Economics – Japan Interest Rate: Link
- Reuters – Currency Coverage: Various articles on yen and carry trades
- Investing.com – USD/JPY Historical Data
- Bank of Japan – Official Statements
- Federal Reserve – Monetary Policy Releases